Max. Temperature
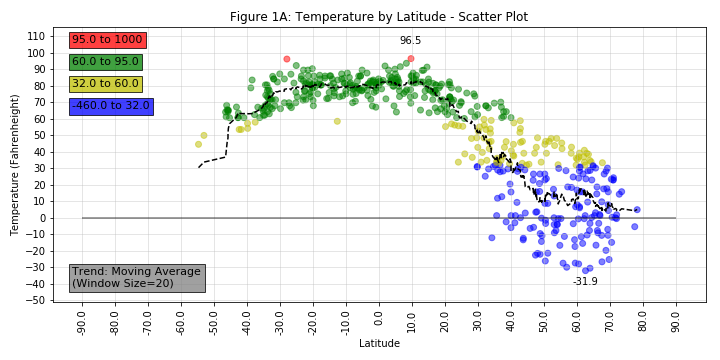
The moving average trend line scatter plot of per-city temperature by latitude shows a clear relationship between temperature and latitude. It is interesting to note that there is less variation in the southern latitudes (0 to -90 deg) vs. northern latitudes (0 to +90 deg).
A next step that might be useful could be to examine variation temperature within a specific latitude band based upon longitude or other factors, including level of population, industrialization, etc.
Visualizations